How to find out which of your dashboards anyone actually reads
Every BI estate has dashboards nobody opens. The usage logs to prove it are already sitting in your tool, and the audit is a day's work, not a project.
The request usually arrives with an apology attached. Someone in finance says they know it is a big ask, but could they possibly get a view of margin by region, weekly, with last year alongside. There is already a dashboard that does exactly that. It was built fourteen months ago, it sits three folders deep in a workspace called Reporting (Old), and nobody remembers it. So a new one gets built. It takes an afternoon, everyone is pleased, and the estate grows by one.
That is how BI estates actually get large. Not through a bad decision, but through a hundred small reasonable ones, because building a new dashboard has always been cheaper than the archaeology required to find the old one. A search box that matches on titles cannot help when the titles are Margin v2, Margin Final, and Regional P&L (use this one).
Eventually someone asks how many dashboards there are, the answer comes back in the hundreds, and an audit gets commissioned. Most audits at this point go wrong in a predictable way: they measure the wrong thing, delete something that mattered, and lose the room.
The logs already know
Every serious BI tool records who opened what and when, and most teams have never queried it. In Power BI the activity events are available through the audit log and the admin APIs. Superset writes to its own metadata database, where the logs table carries a row per dashboard load with a user id and a timestamp. Looker, Tableau, Metabase all keep an equivalent. This is not a project. It is a table you can query in an afternoon.
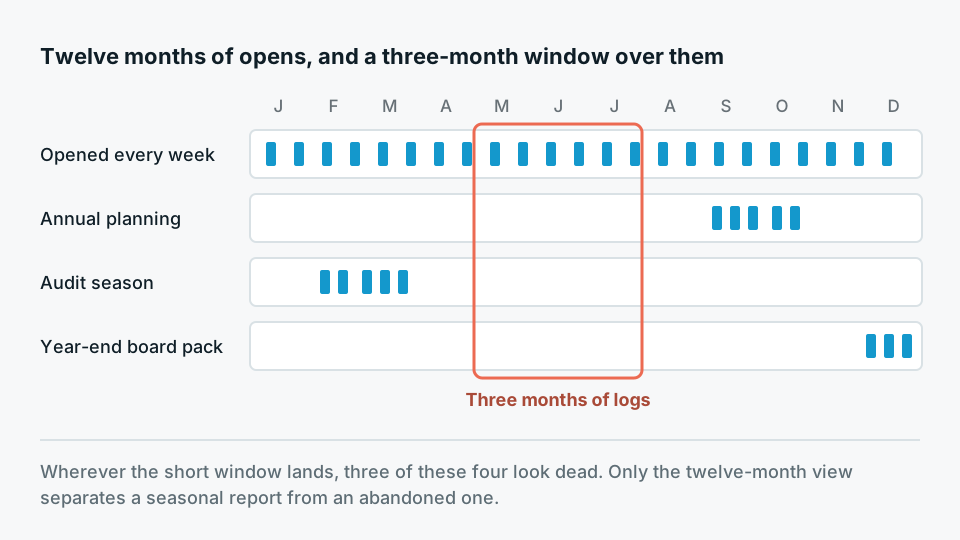
Pull twelve months, not three. Three months of usage data will condemn every quarterly report in the business, and quarterly reports are frequently the ones an executive committee actually acts on. Twelve months catches the annual planning cycle, the audit season, and the one report that only matters in the fortnight before the year-end board meeting.
Then join usage to the warehouse. The BI logs tell you what humans opened. The query history in Snowflake, BigQuery or Postgres tells you what the tool asked the warehouse for, including everything running on a schedule with no human at the other end. The gap between those two lists is where the money is. A dashboard nobody has opened since March, still refreshing hourly, is a standing charge with no reader.
Four buckets, not a score
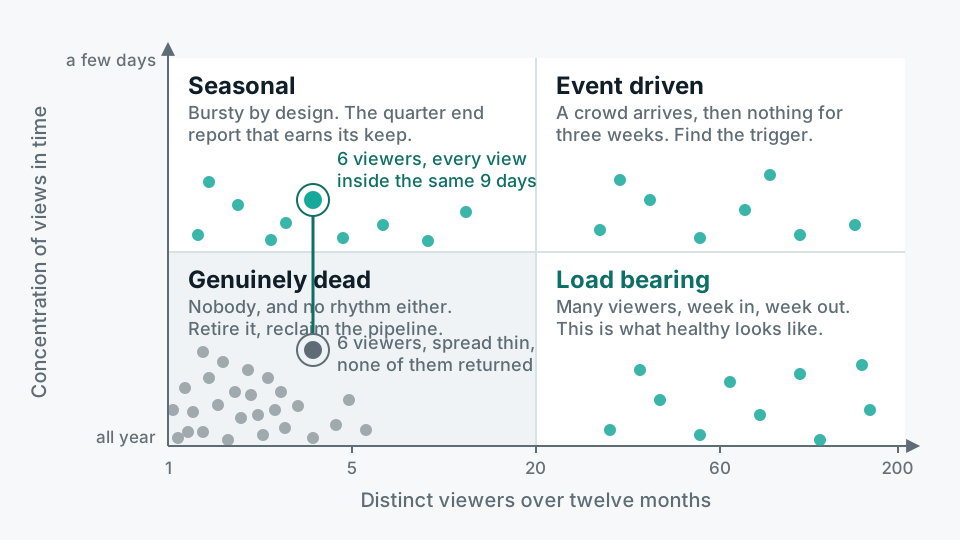
The temptation is to build a composite score, weight the inputs, and rank everything from one to four hundred. Resist it. A score invites an argument about the weights and lets people relitigate their own dashboard's position. Buckets are harder to argue with because each one implies a different action.
- Load-bearing Opened regularly by more than a handful of people, or opened rarely by people whose decisions are large. Leave these alone until the rest of the work is done.
- Single-owner One person, opening it often. Frequently a genuinely valuable analysis that never got promoted. Talk to that person before touching it.
- Seasonal Near-zero usage for most of the year, then a sharp cluster. Almost always legitimate. This is the bucket a three-month audit destroys.
- Dead No human opens in twelve months, no downstream dependency, and the original requester has left or does not recognise it. This is the only bucket you can act on quickly.
The proportions vary enormously between organisations, and anyone who tells you what percentage will be dead has not looked at your estate. What is consistent is that the dead bucket is larger than people expect and the seasonal bucket is the one that gets them in trouble.
Lineage decides what is safe to remove
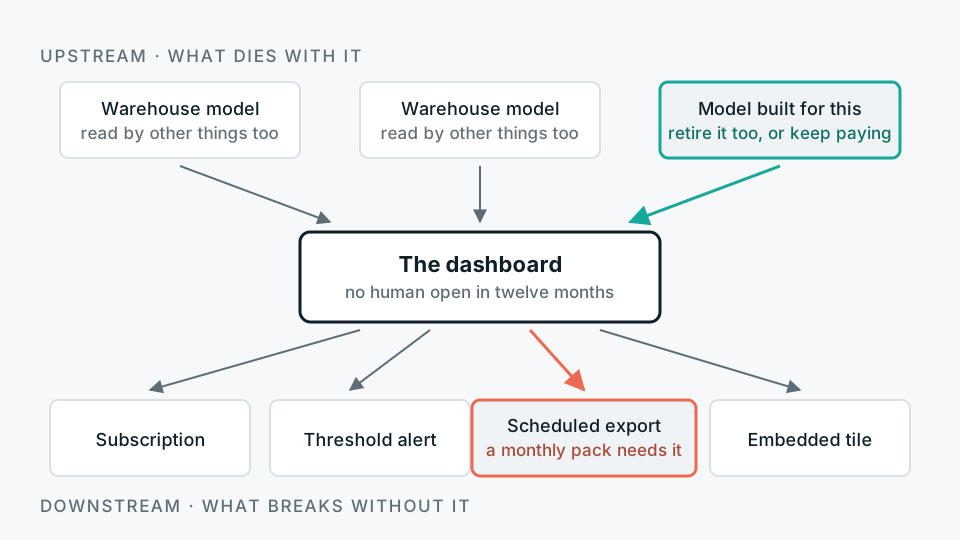
Usage data tells you what people look at. It does not tell you what breaks. A dashboard with no viewers may still be the only thing exporting a CSV that someone's monthly pack depends on, and dashboards are frequently the informal API of a business.
So before anything is retired, run the dependency question in both directions. Downstream: what subscriptions, alerts, scheduled exports and embedded tiles point at this asset. Upstream: which warehouse models does it read, and are those models read by anything else. If a dbt model exists solely to feed one dead dashboard, that model is dead too, and retiring the dashboard without retiring the model leaves you paying for a pipeline with no consumer.
Deleting a dashboard removes a symptom. If the definition it encoded lives nowhere else, you have simply moved the problem into somebody's spreadsheet.
The pattern, stated plainly
The part that is not technical
People are attached to dashboards they built. An audit that arrives as a list of things to delete, produced by someone with warehouse access and no relationship to the business, will be resisted, and the resistance is reasonable. The person who built it remembers a real problem it solved.
A retirement process that survives contact with an organisation looks roughly like this.
- 01Publish the evidence firstShare the usage numbers per dashboard before proposing anything. Let people see their own asset's figures. Some will retire their own work once they see the reality, and that is the cheapest deletion available.
- 02Archive, do not deleteMove candidates to an archive folder with access retained. Nothing is destroyed, so nothing needs defending.
- 03Wait a quarterAnything genuinely seasonal will surface during this window with someone attached to it who can explain the use. That complaint is the audit's most useful signal, not a failure of it.
- 04Then delete, and clean upstreamRemove the dashboard and the models, extracts and schedules that existed only for it. This is where the cost reduction actually lands.
Where the audit is the wrong project
If your estate has four hundred dashboards and no semantic layer, the audit will remove some of them, and in eighteen months you will have four hundred again. The count is not the disease. Duplication happens because there is no single place where revenue, active customer and gross margin are defined, so every new question requires a new asset that re-derives them, slightly differently.
When we see that, we say so. A cleanup that is not followed by consolidating definitions into a governed layer, with certified assets built on top of it, is a tidy-up rather than a fix. The audit is still worth doing, partly because the usage data tells you which definitions are worth lifting into that layer first. But sold as the solution on its own, it is a project that has to be repeated, and repeat projects are how consultancies stay busy rather than how clients get better.
The healthier end state is not a small number of dashboards. It is an estate where anyone can tell, from the outside, which assets are maintained and which are somebody's experiment. Certification, ownership, a visible last-reviewed date. Once that distinction is legible, the estate can grow without becoming a swamp, and the audit does not need running again.