Glimvia

Mobile-first KPI alerting, built on the Superset dashboards you already have

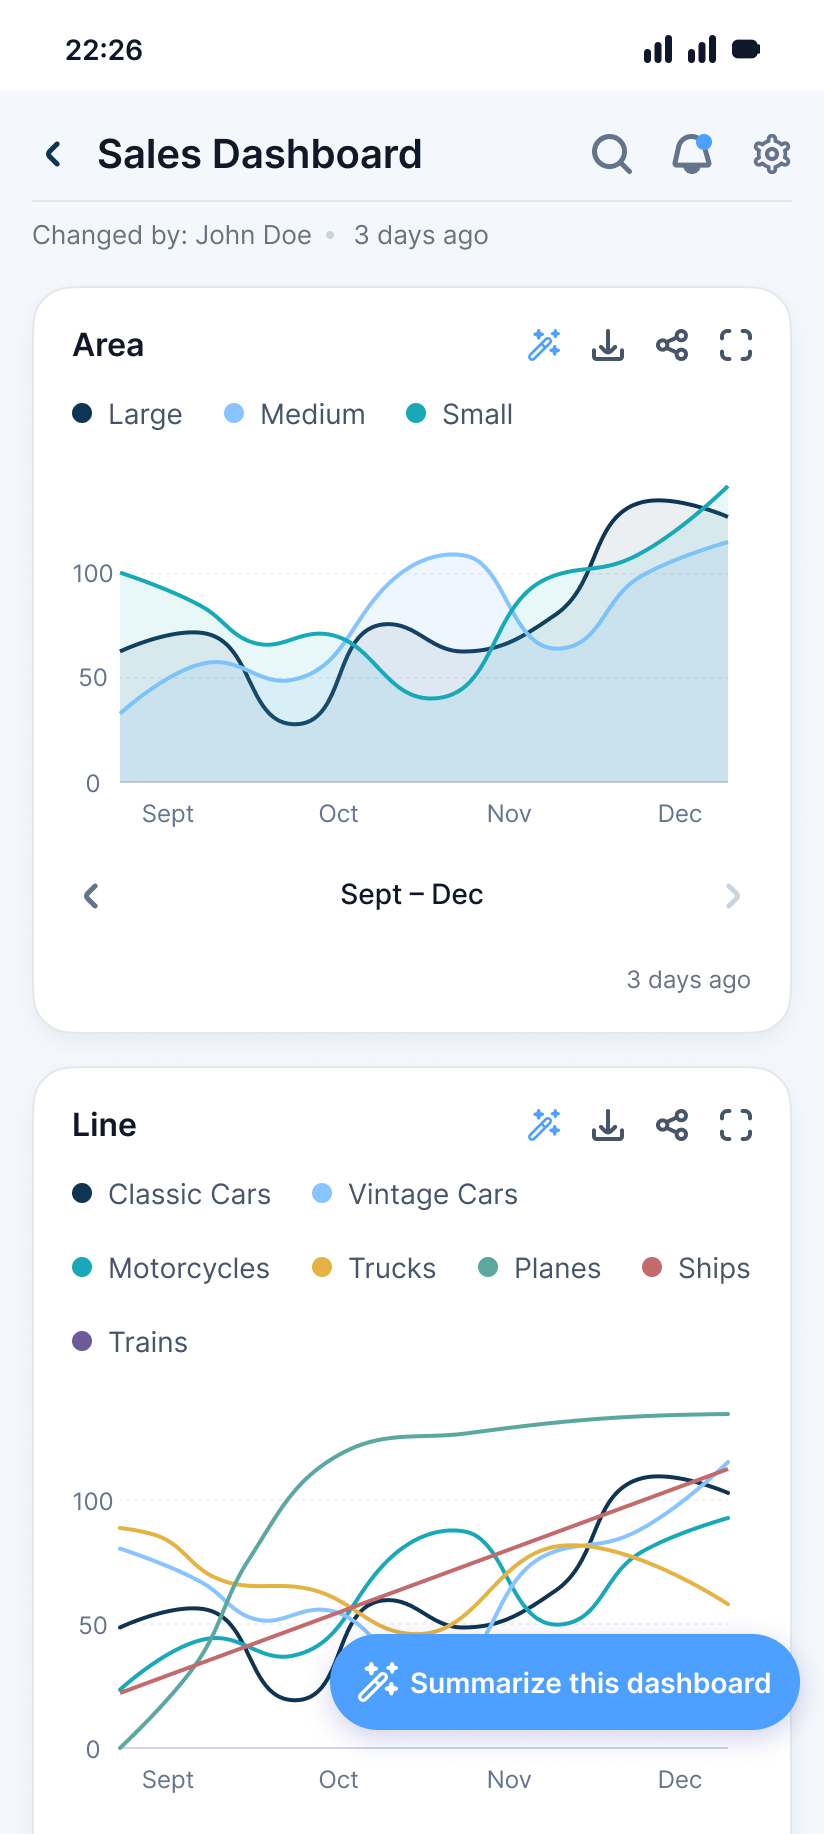
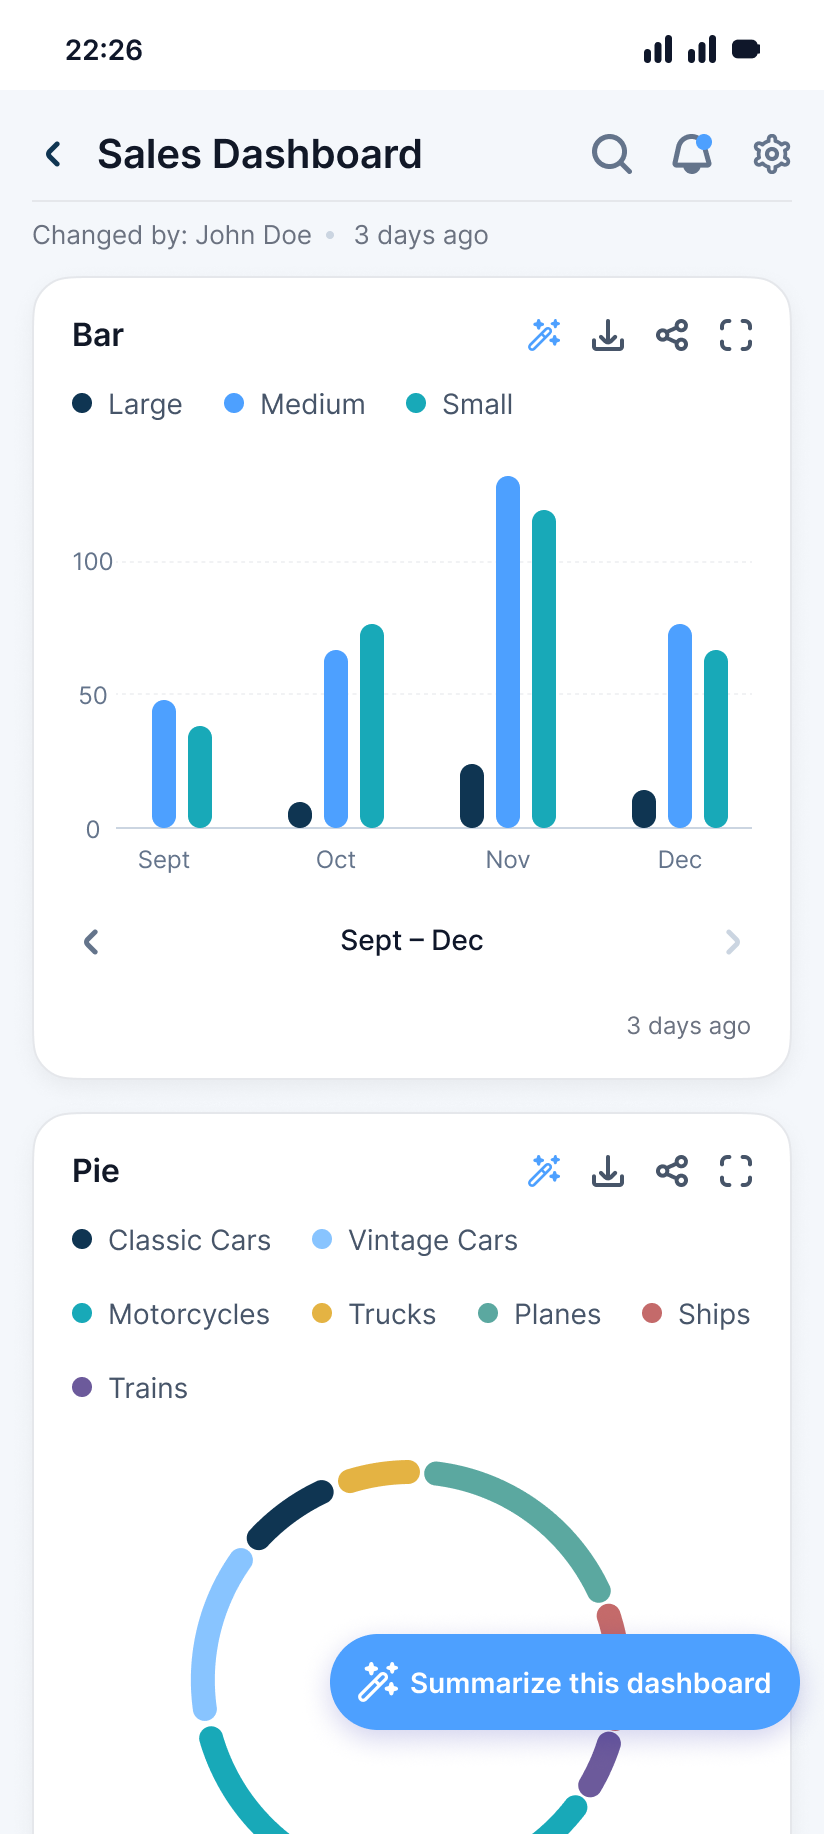
Glimvia watches the metrics on your existing Superset dashboards and sends a structured push notification the moment a threshold is crossed, so decisions do not wait for somebody to open a dashboard and look.

The shape of a Glimvia alert

Two counts and one platform describe most of what the product does.

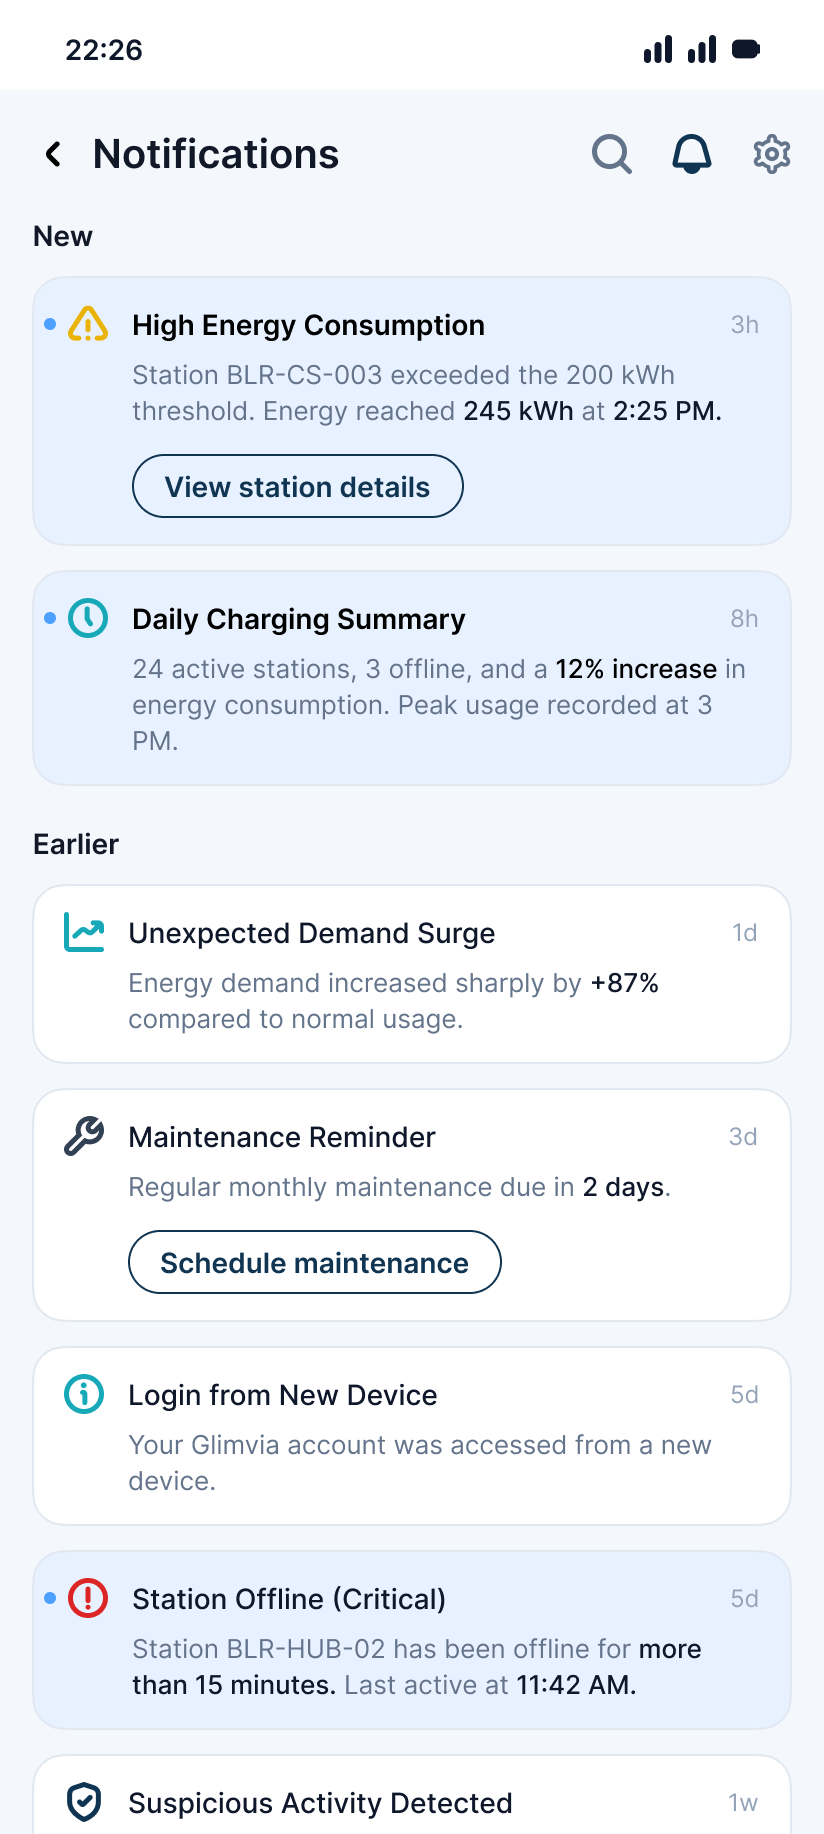
5Fields in every notificationKPI name, threshold value, actual measured value, timestamp and severity indication all travel inside the push notification rather than behind a link.
4Settings behind every ruleThe metric threshold, the trigger condition, the monitoring period, and how the alert behaves once the condition is met.
SupersetThe only platform requiredRules are written against Superset dashboards you already run. Nothing is redefined for the alert, so the number in the notification is the number on the dashboard.

What happens between a metric moving and somebody knowing

Five steps, none of which require a person to open a dashboard.

  1. Rule

    A threshold is written against a dashboard metric

    You pick a metric from a Superset dashboard you already run, set the trigger condition and the monitoring period, and decide how the alert should behave.

  2. Watch

    The rule is evaluated continuously

    Glimvia keeps checking the metric rather than waiting for somebody to look. Nobody has to remember to open the dashboard.

  3. Breach

    The value crosses the line you set

    The moment the condition is met, the alert fires. There is no daily digest to wait for and no reporting cycle to sit inside.

  4. Notify

    A structured push notification reaches the phone

    Not a link saying that something changed. The metric, the threshold, the measured value, the time and the severity all arrive inside the notification itself.

  5. Record

    The alert is written to history

    Every alert is retained with its status, active or resolved, so the sequence can be reviewed later rather than reconstructed from memory.

What the notification actually contains

The alert is built to be acted on without opening anything.

  • KPI name

    Which metric moved, named as it is named on the dashboard, so nobody has to work out what the alert is even about.

  • Threshold value

    The line that was set, shown beside the breach, so the alert reads on its own on a phone screen.

  • Actual measured value

    What the metric was when the rule fired. The gap between this and the threshold is the size of the problem.

  • Timestamp

    When the breach happened, rather than when somebody got round to noticing it. This is what makes response time measurable at all.

  • Severity indication

    How serious the breach is, so a phone with several alerts on it can still be triaged quickly.

These five fields are what Glimvia sends. Delivery is a mobile push notification, and the point of carrying the values inside it is that the dashboard never has to be opened to understand the alert.

What each field in the notification settles

The five values are chosen so the alert can be read and triaged on a phone screen.

  1. KPI nameWhat the alert is about
  2. Threshold valueThe line that was set
  3. Actual measured valueThe size of the problem
  4. TimestampWhen the breach happened
  5. Severity indicationWhich alert to handle first
Left is the five fields Glimvia sends. Right is the question each one answers without the dashboard being opened.

The four things you set when you write a rule

Rules are defined directly against Superset dashboards, not against a separate copy of the numbers.

  1. Metric

    Set the threshold

    The metric already exists on the dashboard. Nothing is redefined for the alert, so the number in the notification and the number on the dashboard are the same number.

  2. Condition

    Define the trigger

    Decide what actually counts as a breach, so a metric moving inside its normal range does not put a notification on anybody's phone.

  3. Period

    Configure the monitoring window

    A rule that matters during a working shift does not need to be evaluated the same way overnight.

  4. Behaviour

    Control how the alert acts

    Set how the alert behaves once the condition is met, so each rule fires the way that rule deserves rather than the way every rule does.

What sits around the alerts

Four things that make the alerts usable rather than merely fast.

SummariesAI-generated

Context on top of the notification

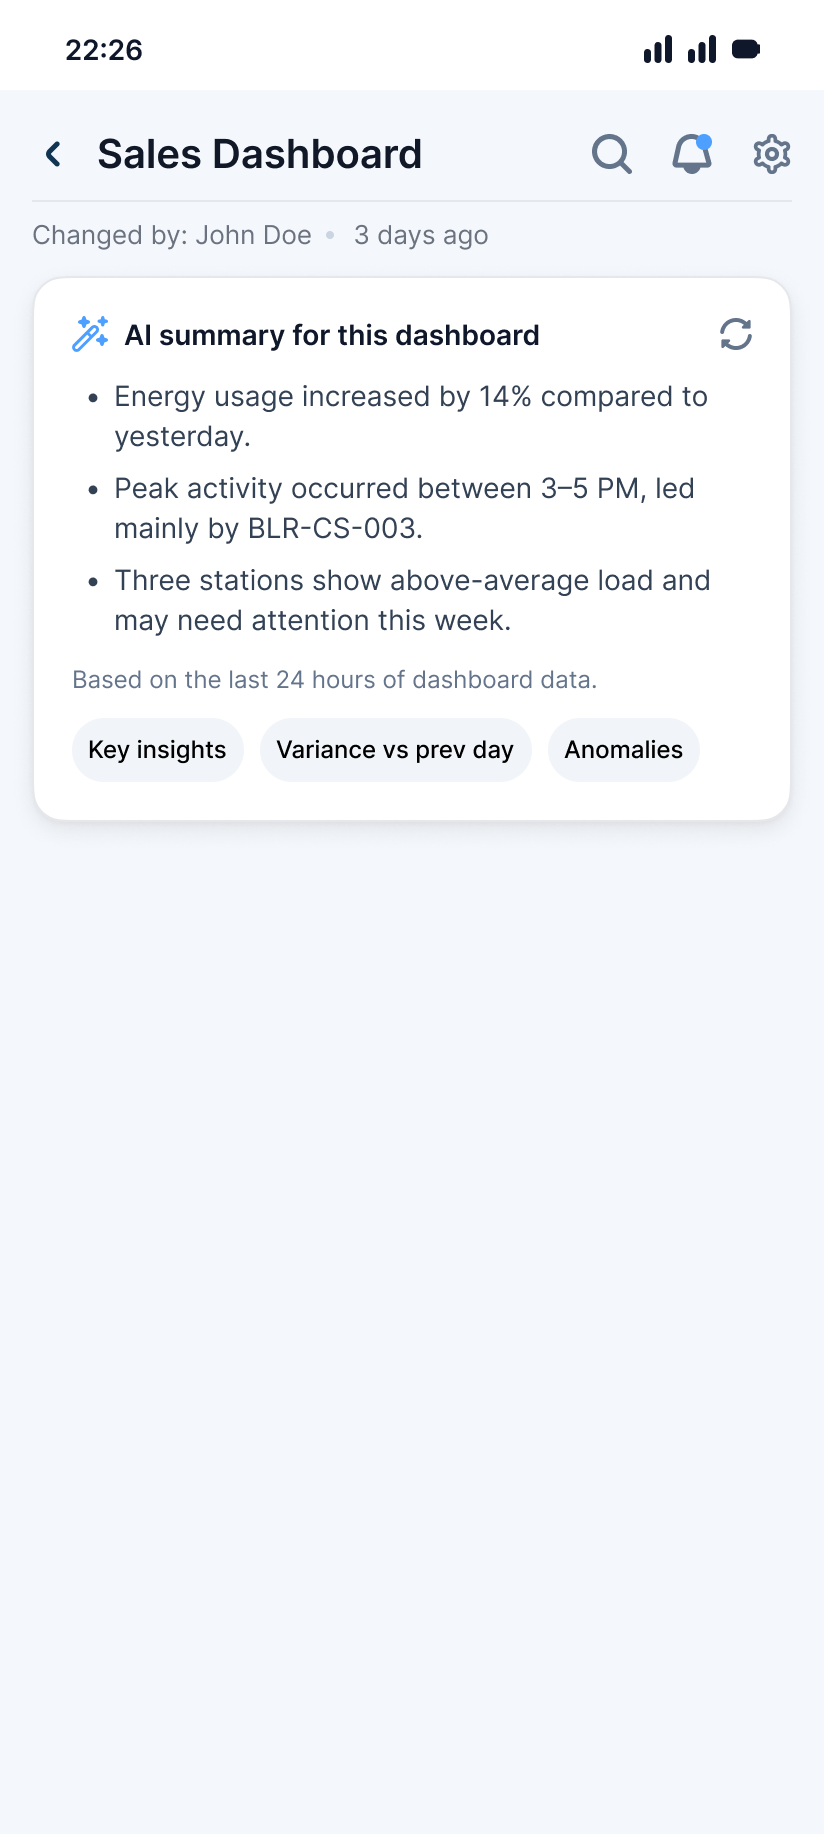
Automated summaries of recent dashboard activity: variance against previous periods, peak activity windows, and the entities or stations that need attention.

HistoryRetained

A structured alert record

KPI name, threshold, actual value, timestamp and status are kept for every alert, which is what makes review and operational audit possible after the fact.

PlatformSuperset

It reads the dashboards you have

Glimvia connects directly to existing Superset dashboards rather than asking you to rebuild your reporting somewhere else first.

Superset analytics
RangeProducts

The rest of what we build

Glimvia is one of several products we run. The index lists the others, including, our monitoring platform.

View all products

How a Glimvia rollout runs

The same shape as every engagement we run, with the audit deciding whether alerting is the right thing to build at all.

  1. Week 1

    The fixed-fee audit

    Two calls and a one-pager you keep either way: which metrics carry decisions, who would act on a breach, and whether Glimvia belongs in your case.

  2. Weeks 2-6

    Build

    A pod of three connects Glimvia to your Superset dashboards, writes the first rules with the people who own those metrics, and gets alerts landing on real phones.

  3. Week 7 onward

    Operate

    Rules are tuned against what actually fired. The alerts nobody acted on are the ones to rewrite or switch off.

Where Glimvia is the wrong answer

Four cases where we would rather tell you in week one than in week four.

Your reporting does not run on Superset

Glimvia is built on Superset and connects to Superset dashboards. If your reporting lives in another tool, this is not a drop-in, and moving your estate to make an alerting product fit is the wrong order to do things in.

The numbers underneath are not trusted yet

An alert on a figure people already argue about only makes the argument arrive faster. If the pipeline is the problem, fix the data first and add alerting once the metric is one people would act on.

No one owns the response

An alert is only worth sending if somebody acts on it. If a breach has no owner and no defined next step, you will have built a quicker way of being told about a problem nobody was going to fix.

The metric is noisy by nature

Threshold rules suit metrics with a line worth defending. If a number swings constantly for ordinary reasons, no threshold is meaningful, the alerts become background noise, and the notifications get muted.

What happens to a dashboard after it is built

Most organisations build dashboards and then rarely monitor them, and the consequences are predictable.

  1. Critical deviations go unnoticedRules are evaluated continuously
  2. Leadership reacts late to operational issuesThe alert arrives as the breach happens
  3. KPI changes are discovered manuallyA threshold breach triggers on its own
  4. There is no structured alert trackingEvery alert is retained with its status
  5. The dashboard has to be opened to learn anythingThe values travel in the notification
Left is what tends to happen once a dashboard project ends. Right is what changes when the metrics on it are monitored rather than only displayed.

Common questions about Glimvia

Five things worth knowing before you start.

Does Glimvia replace our dashboards?

No. It sits on top of them. Glimvia connects directly to your existing Superset dashboards and converts the metrics on them into monitored rules, so the dashboard stays where it is and keeps doing what it does. What changes is that the metrics are evaluated continuously instead of only when somebody opens the page.

What exactly arrives on the phone?

A structured push notification carrying the KPI name, the threshold value, the actual measured value, the timestamp and a severity indication. The values are in the notification rather than behind a link, which is the difference between an alert you can triage while walking and one that needs a laptop.

Do we have to be on Superset?

Yes. Glimvia is built on Superset and reads Superset dashboards. If your reporting sits elsewhere, Glimvia is not the product for you as it stands, and the audit will say so rather than proposing a migration to justify a licence.

What are the AI summaries based on?

Recent dashboard activity. They highlight KPI variance against previous periods, peak activity windows, and the entities or stations that need attention. They are context on what has already happened, sitting on top of the alerts, and should not be read as forecasts.

Can we see what alerted last month?

Yes. Glimvia keeps an alert history: the KPI name, the defined threshold, the value recorded at the breach, the time of the alert, and whether it is active or resolved. That record is what makes review and operational audit possible rather than a matter of who remembers what.

Start with the audit and find out whether alerting is what you need

Two calls, a fixed fee, and a one-pager you keep either way. Which Superset metrics carry decisions, who would act on a breach, and whether the honest fix is alerting or the data underneath it. If it is the latter, we will say so.